mailto:werner@yellowcouch.org

 Because the
spreadsheet has many operations on multiple images, it
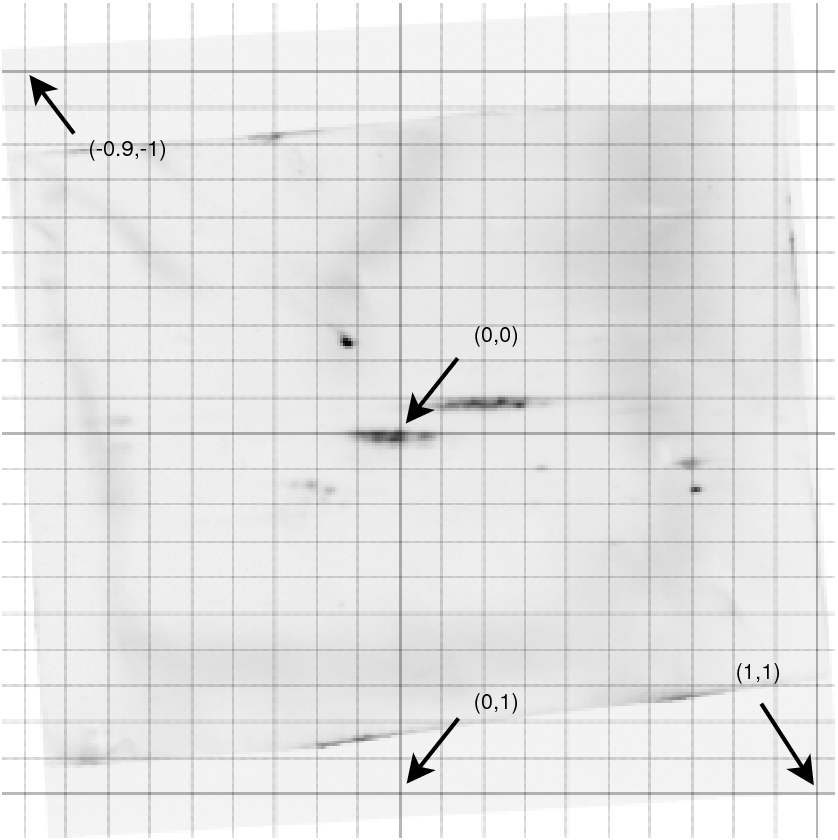
needs to know how to map a position in one image to another image. E.g;
a specific calibration spot should always be at the same virtual
location, regardless of the image. To achieve this, the spreadsheet
associates with every image a virtual coordinate system that can be
modified as necessary. This solves the problem of images that differ in
translation (a calibration spot located at different positions),
scaling (a difference in time based mass seperation might lead to
different zoom factors), image resolution and image aspect ratio.
Because the
spreadsheet has many operations on multiple images, it
needs to know how to map a position in one image to another image. E.g;
a specific calibration spot should always be at the same virtual
location, regardless of the image. To achieve this, the spreadsheet
associates with every image a virtual coordinate system that can be
modified as necessary. This solves the problem of images that differ in
translation (a calibration spot located at different positions),
scaling (a difference in time based mass seperation might lead to
different zoom factors), image resolution and image aspect ratio.| http://werner.yellowcouch.org/ mailto:werner@yellowcouch.org |  |